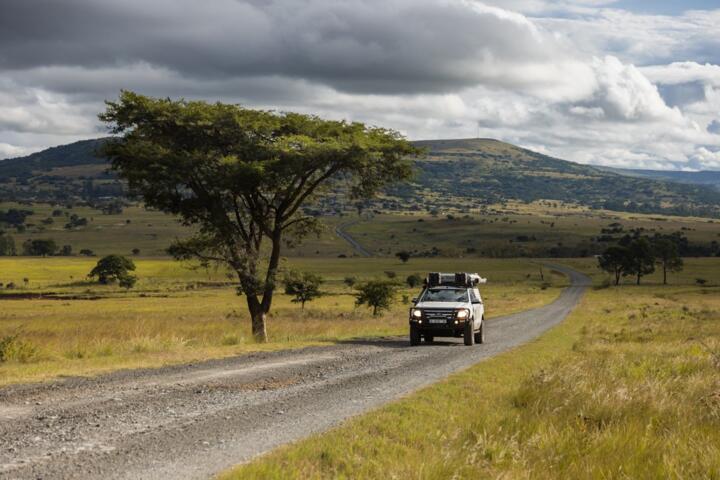
Distances Feel Longer
On many maps, two places in Africa look close because the projection flattens a curved surface and the route line ignores how people actually move. A “1000 km” drive on paper can become 14–20 hours of wheel time plus border delays, detours, and fuel stops that do not show up on route planners. The mismatch grows when roads switch from paved to gravel, when towns are spaced far apart, and when the last reliable service point sits well beyond the next settlement.
Real travel time depends on average speed, not the distance number. Average speed drops sharply on corrugations, sand, steep grades, and sections with frequent slow traffic. Even if a vehicle can cover 80 km in an hour on a good highway, it might cover 40 km in an hour on washboard roads, and 20 km in an hour in deep sand. That difference compounds across a whole itinerary, so the “bigger than it looks” feeling is usually arithmetic plus friction.
There is also a human layer: border posts, permits, and queue behavior vary by day and season. A route that looks like a single crossing can involve multiple checkpoints, vehicle inspections, and document checks that take longer than the drive segment itself. I’ve seen travelers plan around a border “opening time” and still lose half a day to paperwork loops—one small detail, like a missing copy of a vehicle registration, can turn a short stop into a long one.
Main Reasons People Misjudge
People often treat distance as a single number, then assume travel time scales linearly. Roads do not behave linearly: a 200 km paved segment can be followed by 200 km of gravel with washboarding, then by 50 km of rough tracks where navigation errors cost hours. Route planners may label roads as “major” even when they are intermittently passable, and they rarely model the time lost to detours around washouts or seasonal closures.
Supporting technologies and dependencies shape the outcome. GPS routing depends on map data quality, which can be uneven in remote regions; a route that looks continuous can route you onto a track that becomes impassable after rain. Cellular coverage affects communication and payment options; when connectivity drops, you may need cash, paper receipts, or in-person confirmation. Vehicle readiness matters too: tire pressure choices, brake condition, and cooling performance change how fast you can safely travel on grades and dust-heavy stretches.
Weather adds another non-obvious multiplier. Heavy rain can turn laterite roads into mud, and even when the road “dries,” ruts remain. Wind and heat can increase fuel consumption and reduce engine performance, which affects how often you can reach the next fuel point. In some areas, the practical limit becomes not the distance but the spacing between reliable services, which can be far wider than the spacing between towns on a map.
How To Plan Realistic Days
Estimate Time From Road Type
Start by breaking the route into segments by road surface and expected conditions. Use conservative average speeds: for paved highways, many travelers plan around 60–90 km/h depending on traffic; for well-graded gravel, 40–60 km/h is a common planning range; for corrugated or sandy sections, 20–40 km/h is safer. Then add buffer time for slowdowns at towns, livestock crossings, and fatigue stops. If you do this in a spreadsheet, you can see how a 300 km gravel section can add 2–4 hours compared with a paved assumption.
A practical method is to check recent trip reports and satellite imagery for the same corridor, then compare them with the road labels in your navigation app. I once compared a route in Google Maps with an offline map pack downloaded in March 2024; the offline layer showed a road that later reports described as seasonally blocked. That mismatch didn’t change the distance, but it changed the plan.
Budget Border And Permits
Treat border crossings as a separate time budget, not a quick stop. Plan for vehicle inspection, document verification, and payment steps that can vary by staffing and queue length. A realistic buffer for a busy land border can be 2–6 hours, while some crossings can take longer when paperwork is incomplete or when systems are down. If you travel with a rental vehicle, confirm who handles export/import paperwork; some rentals restrict cross-border movement or require written authorization.
Carry printed copies of key documents and keep them organized in a folder you can reach without unpacking everything. When you rely on a phone for scanned documents, battery drain and weak signal can turn a “minor” issue into a delay. A small aside: I’ve watched travelers lose time because the document name on a form didn’t match the name on the vehicle registration, and the correction required a supervisor.
Plan Fuel And Service Spacing
Fuel planning often decides whether you can keep a schedule. Use the vehicle’s real consumption under local conditions, not a brochure figure. If your vehicle averages 10 L/100 km on a highway but climbs to 14–18 L/100 km on gravel, your range shrinks by 20–40%. Then check whether fuel stations exist at intervals that match your reduced range, and plan to refuel earlier than the “last safe stop.”
Also plan for water, tires, and basic repairs. A spare tire and a jack help, but the ability to change a tire on uneven ground matters too. If you drive in remote areas, carry a tire pressure gauge and learn how to adjust pressures for gravel and sand; many delays come from slow tire work rather than from the original puncture.
Use Route Tools With Offline Backups
Navigation tools help, but they fail when map data is incomplete or when roads change. Download offline maps for the corridor and keep a second navigation method, such as a downloaded GPX track or a paper map for the final approach to towns. Check the route for “gaps” where the app routes you onto a track that may not exist in the real world. If you see a route that crosses a river without a bridge, verify the crossing method through recent sources, because water levels can change quickly.
For timing, use a travel-day model rather than relying on the app’s ETA. The ETA often assumes steady speeds and ignores stops. A simple approach is to set a maximum driving window (for example, 6–8 hours of driving) and treat the rest as buffer for meals, repairs, and border steps.
Case Examples For Estimation
Example: Coastal To Inland
A traveler plans a coastal-to-inland route that looks like about 900 km on a map. The first 400 km is paved, followed by 350 km of gravel, then 150 km of rough access roads to a reserve. If they assume 80 km/h for the whole distance, they estimate 11–12 hours of driving. Using conservative segment speeds (80 km/h paved, 50 km/h gravel, 30 km/h rough), the wheel time becomes roughly 5 hours + 7 hours + 5 hours, or about 17 hours. Add a border or permit stop of 3–5 hours and two fuel/refuel breaks, and the “one-day” plan becomes a two-day plan.
The lesson is not that the distance is wrong; it’s that the route’s friction changes the average speed. The map distance stays the same while the time budget changes.
Example: Dry Season Versus Rain
Another scenario involves a route that is passable in the dry season and slow in the wet season. In dry months, a laterite road might support 50–60 km/h for long stretches. During rain, the same corridor can drop to 15–25 km/h because ruts form and vehicles must crawl to avoid getting stuck. If the route planner still shows the same distance and road type, the ETA can be off by 30–70%.
In this case, the traveler’s best adjustment is to plan fewer kilometers per day and to schedule a buffer day near the most weather-sensitive segment. That choice reduces the chance of arriving after dark when recovery options are limited.
Checklist For Route Reality
| Planning Item | What To Check | Practical Rule Of Thumb | Why It Changes Distance Feel |
|---|---|---|---|
| Road Surface | Paved vs gravel vs rough track | Use 80/50/30 km/h planning speeds | Average speed drops, time grows |
| Border Time | Queue, inspections, paperwork | Add 2–6 hours buffer | Delays don’t scale with distance |
| Fuel Spacing | Next reliable station distance | Refuel before range hits 50–60% | Range limits force extra stops |
| Weather Risk | Ruts, washouts, river levels | Add a buffer day near sensitive segments | Speed collapses on wet roads |
Step-by-step checklist you can apply before booking: (1) Split the route into surface types, (2) assign conservative speeds per segment, (3) add a border buffer separate from driving time, (4) verify fuel spacing against your real consumption, (5) download offline maps and plan a fallback route for the last 50–100 km, (6) schedule arrival before dark with a hard stop time, and (7) keep one spare day near the most uncertain corridor.
Common Mistakes That Inflate Time
One frequent mistake is trusting a single ETA from a navigation app without checking the road surface assumptions behind it. Another is planning “one long day” repeatedly, which increases fatigue and slows driving even on good roads. People also underestimate how often they will stop for food, water, and basic logistics when services are sparse.
Document handling errors are another source of delay. If you travel with a vehicle, mismatched names, missing copies, or unclear ownership can trigger extra verification steps. If you rely on digital documents only, a dead phone or weak signal can force you into manual processes that take longer than the drive itself.
Finally, travelers sometimes ignore the difference between “distance between towns” and “distance between reliable services.” A town on a map might have fuel, but the station may be closed on certain days, or the fuel may be limited. Planning around the next town rather than the next reliable service point makes the route feel longer even when the road is fine.
FAQ
Why do map ETAs look too short?
ETAs usually assume steady travel speeds and do not model border queues, variable road conditions, or extra stops for fuel and repairs, so the time gap grows with each friction point.
How should I estimate driving speed on gravel?
Use conservative planning speeds based on recent reports and road condition: many travelers plan around 40–60 km/h on well-graded gravel and 20–40 km/h on corrugated or sandy stretches.
What border delays should I budget?
For land crossings, a practical buffer is often 2–6 hours depending on traffic and paperwork; longer delays happen when documents need correction or when systems are down.
How do I plan fuel when stations are sparse?
Base range on your real consumption on similar roads, then refuel before you reach the reduced range limit; checking the spacing between reliable stations matters more than the distance between towns.
Does offline navigation fix route problems?
Offline maps reduce signal issues, but they cannot correct wrong road data or missing tracks; you still need a fallback plan and a way to verify uncertain segments.
Author's Insight
The “bigger than it looks” effect comes from average speed falling, not from the map distance changing. Road surface transitions, border procedures, fuel spacing, and weather-driven slowdowns each add time that does not scale with kilometers. Navigation tools help with orientation, but they rarely model friction points like paperwork loops or seasonal road passability. A careful planning workflow—segmenting the route, budgeting border time, and checking service spacing—turns a vague itinerary into a realistic driving calendar.
Key Takeaways
- Map distance stays constant; travel time changes because average speed drops on gravel, rough tracks, and wet roads.
- Border crossings behave like separate time events, so budget hours for queues and document checks.
- Fuel and service spacing often determines how many kilometers you can cover per day.
- Use offline maps and a fallback plan, then sanity-check ETAs against road surface and recent corridor conditions.
- Schedule arrival before dark and keep a buffer day near the most uncertain segment.